Data Stories

Granular temperature anomalies confirm that regional and global trends are aligned.

It can be seen from the figure below that trends in the Asia and Pacific region generally reflect global patterns over time. While the region exhibits slightly greater variability compared to the global average, the peaks and troughs are generally in sync. Despite year-to-year fluctuations, temperatures rose consistently, both regionally and globally, from 1880 to 2023 and acceleration can be observed in both geographic measures from the mid to late 20th-Century.

Trend in Regional and Global Land Surface Temperature Anomalies
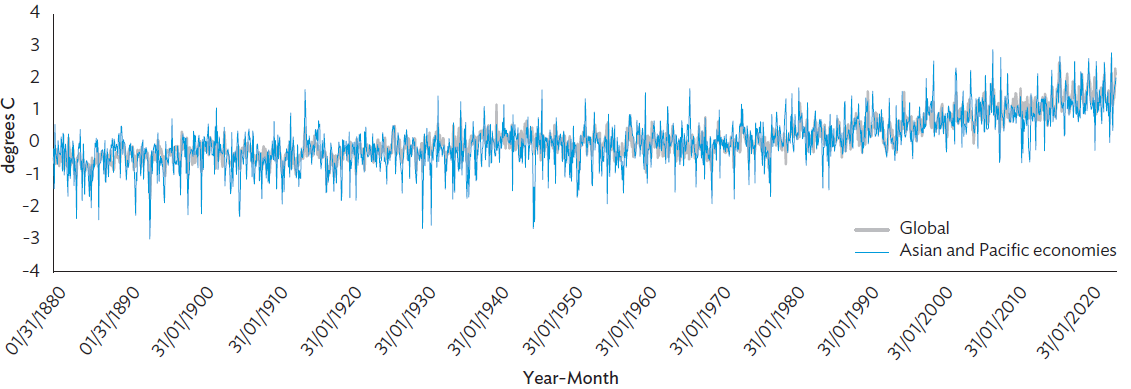
Land surface temperatures globally and across Asia and the Pacific accelerated from the middle of the 20th-Century.
Trend in Regional and Global Land Surface Temperature Anomalies
Notes: Anomalies are with respect to the 20th-Century average (1901-2000). Global monthly anomalies were sourced from National Oceanic and Atmospheric Administration’s National Centers for Environmental Information, while those for Asia Pacific are ADB staff computations using 5-degree resolution global land surface measurements and computations from the same source.
Source: Asian Development Bank analysis using data from the National Oceanic and Atmospheric Administration dataset. (accessed December 11, 2023).

By 2023, almost all land areas within the region were warmer than they were in the previous century. 

The figure below illustrates the changing balance of positive and negative anomalies in Asia and the Pacific from 1880 to 2023. The graph clearly shows a greater proportion of localities within the region recording positive anomalies (red) from about 1950 onward, reflecting the region’s warming trend.

Proportion of Positive and Negative Land Surface Temperature Anomalies in Asia and the Pacific
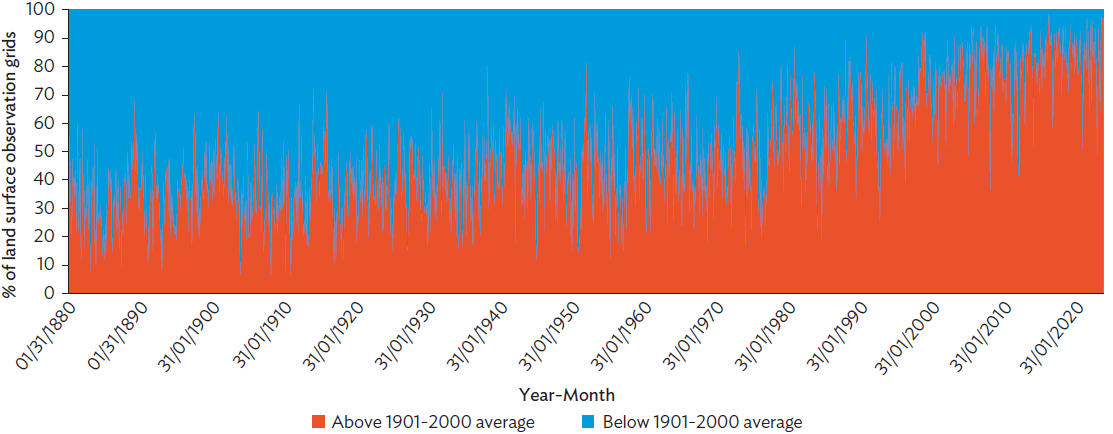
By 2023, almost all land areas within the region were warmer than they were in the previous century.
Proportion of Positive and Negative Land Surface Temperature Anomalies in Asia and the Pacific
FSM = Federated States of Micronesia, km² = square kilometer, Lao PDR = Lao People’s Democratic Republic, PNG = Papua New Guinea, PRC = People’s Republic of China.
Notes: Anomalies are with respect to the 20th-Century average (1901–2000). Monthly temperature anomalies are computed using 5-degree resolution global land surface grid measurements.
Source: Asian Development Bank analysis using data from the National Oceanic and Atmospheric Administration dataset. (accessed December 11, 2023).

About Key Indicators

For more than 50 years, Key Indicators for Asia and the Pacific has presented the latest data on economic, financial, social, and environmental development issues across Asia and the Pacific. It continues to act as a vital resource of data and statistics for policymakers, development practitioners, government officials, researchers, and students around the world.
  • KI2024 Launch Video

© 2024 Asian Development Bank. Terms of Use

ADB encourages websites and blogs to link to its web pages.